
Watch Your Histogram!
Histograms! Sounds like a medical procedure or, worse yet, mathematics.
Well, if you’re a photographer, histograms are your friends. Don’t be intimidated by them. Learn how to use a histogram and your images will dramatically improve.
What Is a Histogram?
In digital photography a histogram is an electronic display of all the pixels, light-to-dark, recorded on the sensor when you press the shutter release. It appears as a graph on the rear LCD screen in DSLR cameras and even on many point-and-shoots, such as the Canon G12.There is really no such thing as a good or bad histogram, as I’ve read online and heard people say. A histogram simply is. And that’s why it is such a great tool. It only records the facts and presents it to you in easy-to-understand fashion. It is up to you to understand what it is telling you and then use that information to improve the image.
A Balanced Example
In the following image I took, you’ll notice that the distribution of the light is pretty even. Yes, there are some bright spots and deep shadows, but nothing glaringly bad about the image’s appearance. Just looking at the light in the image, it appears pretty well balanced.Now look at the histogram for this image.
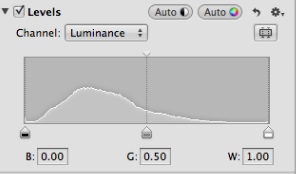
The graph represents the distribution of pixels from dark on the left side of the histogram to lighter pixels as we head to the right. You will note that none of the pixels are knocking into the “wall” at the far left or right. That indicates that the image is not overexposed or underexposed. Overexposed pixels would be stacked high up against the far right wall. That means that one could not discern any details in those highlights. They would appear white and featureless. On the other hand, underexposed pixels would crowd up against the far left wall. No details would be discernible in those black areas.
Underexposed
Take this next image, for example.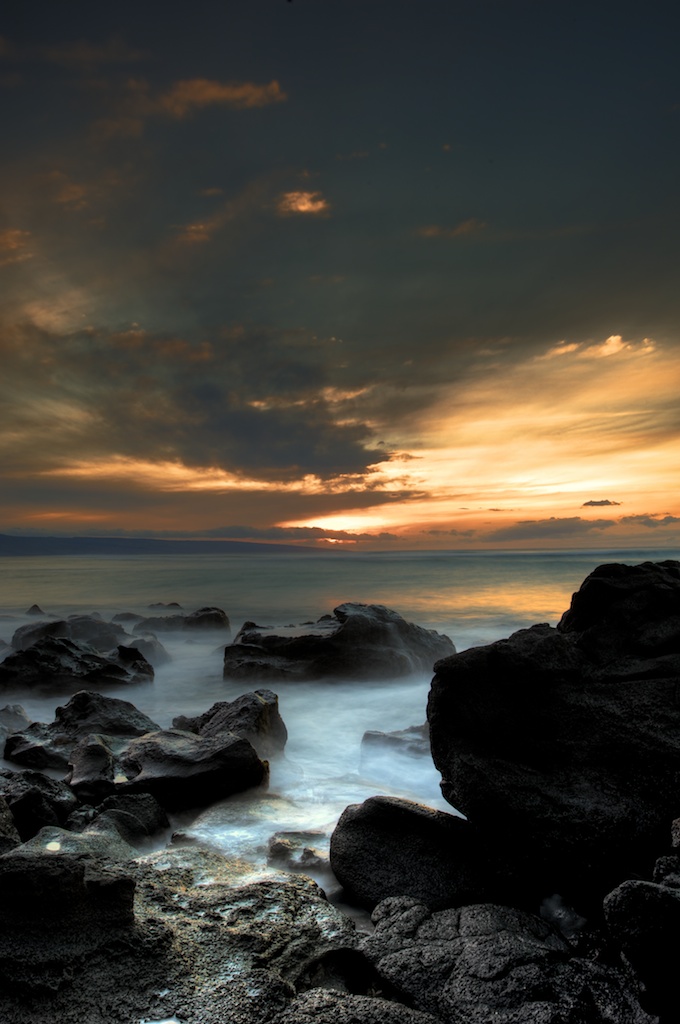
You can see that the image has many dark black, featureless areas where you cannot see any details in the darkest shadows. Actually, that was intentional on my part. I wanted to silhouette that rock on the right and put the emphasis on the sunset, the water and the mid-range rocks. Note the histogram:
Pixels are bumped up against the far left wall. In this case I didn’t mind at all. But, if I had wanted to get some details in the shadows on the right, I would have opened up my aperture perhaps 2/3 or one full f-stop. Alternately, I could have just left the shutter open a bit longer to allow in more light. My point here is that the histogram only gives you data. It’s up to you to make decisions based on it.
Overexposed
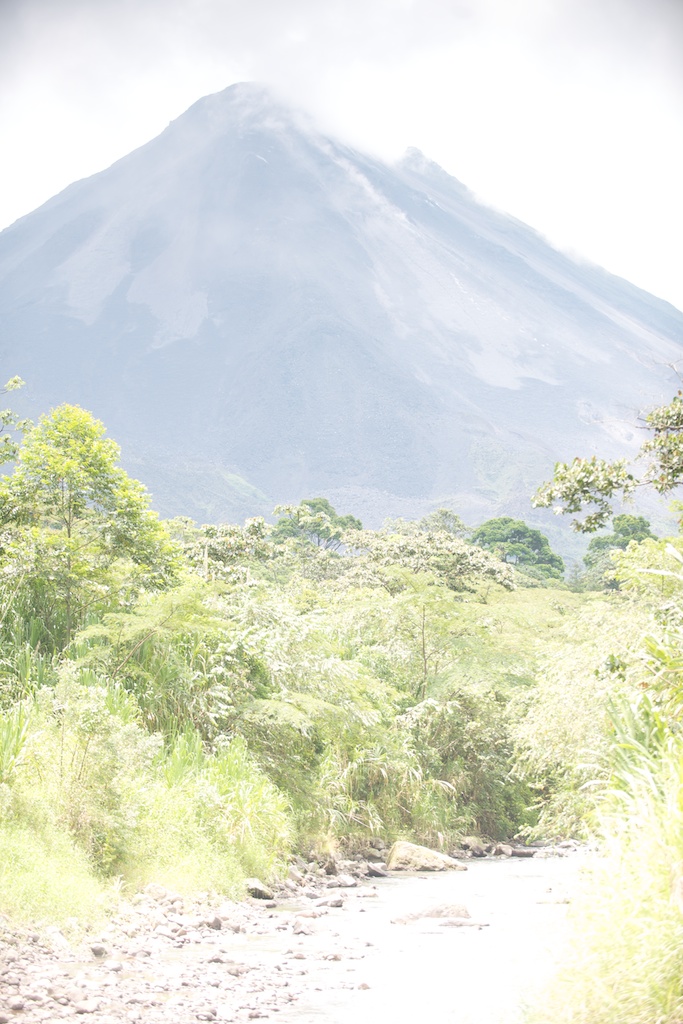
One of the most dreaded results in photography is when you have horribly overexposed areas in an image. We refer to those areas as blown-out highlights. The best way to come home with a well-balanced image is to take a test shot, look at the histogram and check to see if the graph slams into the right side of the wall. If it does, you have blown-out highlights somewhere in the image. Sometimes you will want some blown-out highlights to achieve a certain effect, but most of the time you’ll want to change the aperture or exposure to minimize those overexposed areas.Look at the following image. Notice that it is waaay overexposed. No doubt about it, a very bad shot. The highlights are “blown,” meaning that you cannot discern any details in the lightest areas, even though there were some nice clouds above the mountain. The whole area is featureless.
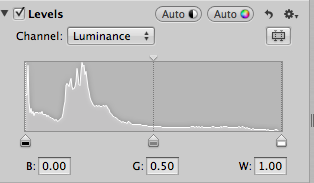
Let’s look at its histogram:
Ouch!! Even pros make mistakes. Here you can see that the pixels are piled up on the right wall, indicating overexposure. No choice here but to re-shoot. I’d have to close down my aperture two or three stops or increase the shutter speed a good deal to let in far less light. But in other cases I might have some blown pixels in the image and be happy with the results. Like I said, histograms just are.
The beauty of digital is that you can shoot again and again, look at your histogram (and the LCD preview image) and decide when you’ve nailed the shot. Combined with the image you see on your LCD screen, using your histogram can result in far better images.